Understanding your local market
 As homeowners, it’s good to know a little bit about the market our home is located in. There’s no need to be a professional statistician but it’s really not necessary. There are a couple of real estate stats that are good to know as they can give us a feel for the temperature of the market. They help answer questions related to whether it is a buyers or seller’s market, whether there is an oversupply of homes, and how aggressive we could be if we wanted to sell our home.
As you know, real estate is always about location. I don’t put a lot of weight in the national housing figures because they don’t necessarily reflect what is happening on the local level. If you want to do that you have to zero in on the sales and listings that have occurred in your neighborhood. By neighborhood, I don’t necessarily mean your immediate subdivision but the general area that would be competitive with yours. This would be one that had the same or similar school system, similar quality and size homes, and similar access to neighborhood support services. Appraisers call this a “competitive market area”.
What I thought I would share with you today are the statistical metrics I think are important and how they relate to your home’s value. In addition, I have included some specific trends that are occurring now in the Shelby County area and also the Alabaster, Pelham, and Helena markets, which is where I do a lot of my appraisal work.
If you live in another area of Birmingham these figures may not mean much to you but if you are in the process of selling your home and need to find out what to sell it for you can always get a pre-listing appraisal because it will include this data specific to your neighborhood. The figures for Shelby County will give you a general idea of how the county is performing and if you live in the Alabaster, Pelham, Helena area you will get a little more focus on that area.
If you are a real estate agent and think these charts would be helpful in explaining the market to your clients let me know and I can email them to you.
Stats that will help you understand this Shelby County market update
1) Median Price-Both average sales price and median sales price can provide an indication of pricing trends. I prefer median sales price because it provides a more reliable number because it is not influenced by outlier sales that can sell for unusually high or low prices. As with any other stat it’s not good to look at only one metric.

 An increase in median sale price can give us an indication that prices are rising due to appreciation or it may also just mean that there were more upper priced homes selling during this time period and less lower priced homes. This is where studying the smaller sub-market is a good idea because it will isolate the sales to a certain location which can give us a better feel for the market.
For Shelby County, the median sale price in July was at approximately $220,000. This is roughly 8% higher than last years median value of $203,000. The median value has been driven up due to decreasing inventory.
The median price for the Alabaster, Pelham, and Helena market in July followed the Shelby County trend and was also higher than last year at $185,000, up $10,000. Part of the decreasing inventory is due to a limited amount of raw land available for new construction development. This is more true for the Alabaster area than it is for Pelham or Helena. It has resulted in most of the sale activity being existing home resales. As I noted Alabaster has had the least amount of new construction of the three cities covered here.
2) Absorption Rate (monthly inventory)- Tied directly to the total homes listed for sale is the months of housing supply statistic. This is a measure of how long it would take to sell out the current inventory of homes given the current rate of sales over recent months without any more homes being added.


In the low and mid price ranges, below $750,000, Shelby County housing inventory is in balance since the maximum inventory is 3.7 months for homes in the $500-$750,000 range. This changes for homes over $750,000 with 12.3 months of supply for homes from $750,000, and it jumps to 17.5 months of supply for homes over $1,000,000.
The Alabaster, Pelham, and Helena sub-market follow a similar trend for homes below $750,000. At prices over $750,000, we see similar supply which is unusual because this area typically does not have an abundance of homes in these upper price ranges.

3) Total Home Sales-The number of homes sold can provide a good indication of the health of the housing market especially when you compare current numbers to past years. Of course, an increase over past years obviously shows an increase in demand which indicates a higher confidence level in economic conditions such as job stability and credit availability.
According to data supplied by the Greater Alabama MLS, Shelby County sales volume in July of 2017 is approximately equal to what it was last year and lower than two years ago. The seasonal trend appears to be similar to the past 3 years. Sales within Alabaster, Pelham, and Helena are showing similar characteristics as Shelby County.

4) Days on Market- The number of days it takes to sell a home provides valuable information because it can give an indication of what type of market we have. A longer than normal time on the market most likely indicates higher inventory levels and/or a decrease in demand, which could provide valuable data to sellers. This may help them make a decision on how aggressively they want to price their home.
The days on market for Shelby County as a whole has steadily decreased over the past 3 years with July of 2017 being at 58 days and the last two years being at 69. The days on market for homes in the Alabaster, Pelham, and Helena area has seen a steady decrease from 80 days in 2015 to 65 days for 2017.
From a buyer’s perspective, this should tell them that if they are interested in purchasing a home they need to put in an aggressive offer and don’t lowball the seller because the seller can probably move on to the next buyer and get their asking price.

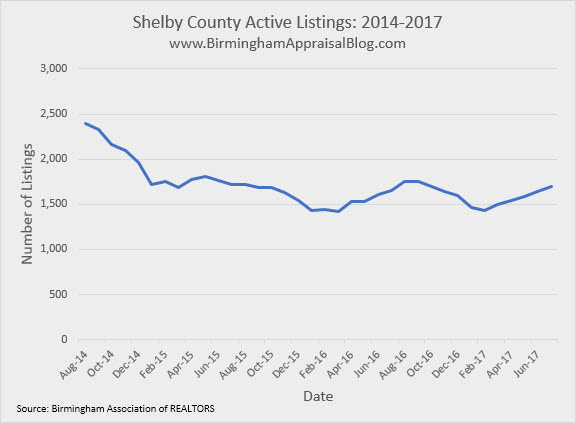
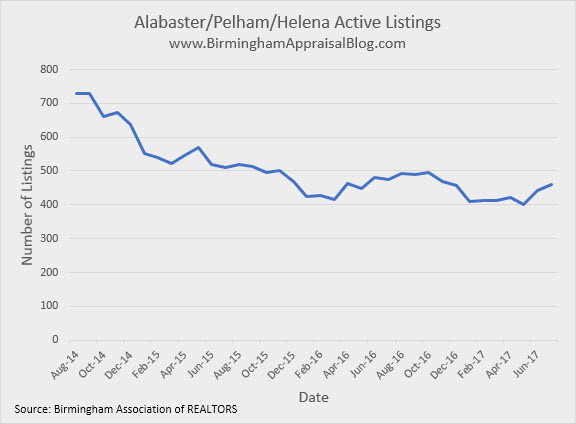
 5) Active Listings- The last stat I wanted to cover is total homes listed for sale, which is just another way of describing current inventory. The national news has indicated that inventory levels are down in most areas and this is certainly true for Shelby County. In August of 2014, the local MLS indicated that approximately 2,400 homes were listed for sale. As is typical, inventory levels have shown seasonal fluctuation, however, as of the writing of this post, the number of listings in July of 2017 was at 1,693. This is close to 2016 levels but down from 2014 and 2015. With decreases in inventory, you have increases in median sold price and decreases in days on market.

 Because real estate is location specific it would be wrong to look at the larger market and assume that the local market is the same. It will give you a more accurate picture of the health of your market if you look at the numbers for your specific neighborhood or subdivision.
Question
So do you have a better understanding of what stats you need to be aware of to determine how your area is performing? If you live in Shelby County or the Alabaster, Pelham, Helena area what are your thoughts? If you have any other questions feel free to contact me.
If you liked this post subscribe by email (or RSS feed). Thanks for visiting.
Great post Tom. I love how all your charts go clear back to 2014. That gives the reader a good context for what is happening now in Shelby County.
Thanks, Gary. I hope that they provide a good illustration of the market.
Tom, these graphs are awesome. What a resource you are to your local community. I love the months of inventory over a few years because it really shows a seasonal dynamic where inventory declines in the spring and increases in the latter part of the year. Top notch stuff here. Way to go!
Thanks, Ryan. After seeing how well your charts illustrate the market I thought I would give it a try. Seeing the various metrics like median price, days on market, and months of supply in chart form really helps to understand it more.