Will We Ever Get Back to a Normal Housing Market?
What is normal? It’s a great question that I get asked a lot. People want to know if the housing market is back to where it was before the pandemic.

A normal market is a moving target. It changes with the seasons and with the economy and anything else that affects people’s pocketbooks and outlook on the future.
Both the economy and the housing market were cruising along and appeared to be very strong prior to Covid. For the most part, Covid was just a bump in the road, but what did that bump look like and how did it affect the most important real estate stats?
In addition to Covid, something else significant happened shortly after the pandemic. We had a lowering of 30 year fixed rate mortgage interest rates to below 3%.
Today I thought I would share with you some charts that might help explain where we were before the pandemic, what occurred shortly after we went into lockdown, and now approximately 18 months later.
A Graphic Look at the Birmingham Real Estate Market
Number of Homes Sold
The number of homes sold over the last several years has continued to grow. Each year saw an incremental increase, however, after starting off strong in 2020 we hit a brick wall.
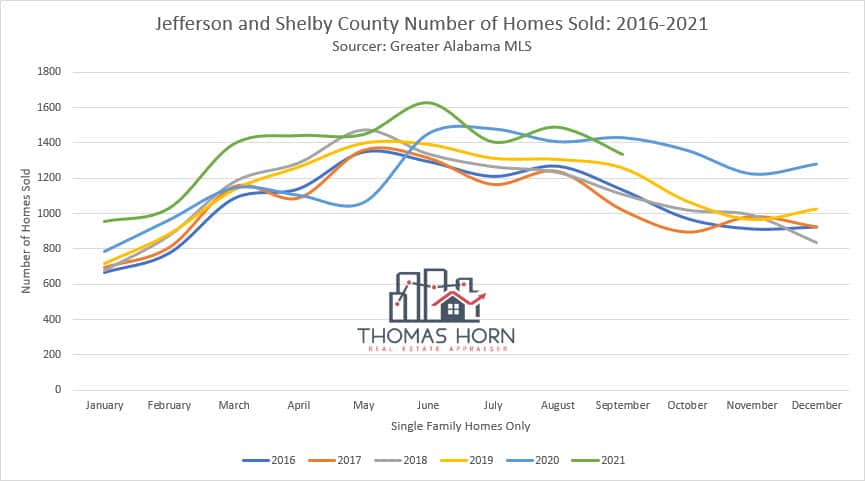
When Covid hit in March we saw an immediate decline in the number of homes sold in the months to follow. Home sales took a dive for approximately 2 months before rebounding to the highest levels going back to 2016.
In 2020 we saw a minor increase of a little more than 1% over 2019, and for 2021 we saw a larger increase of approximately 21% from the prior year in the month of March.
As of the end of September, which is the most recent month with complete data home sales have been less than last year but greater than the prior years.
Median Sold Price
The median sold price in March of 2020 was up approximately 16% from the prior year. Again, just like with the number of houses sold, there was a decrease in median price that bottomed out in May and then started its upward trend again in June.

In 2021 the median sold price for each month has been higher than the prior four years with a slight dip occurring going into the last quarter of the year. This dip appears to be due to the seasonality of sales for this time period.
Days on Market
The lack of supply compared to current demand continues to be the driving force in the market we are in. Low-interest rates have been motivating buyers to get off the fence and pull the trigger when buying a home.
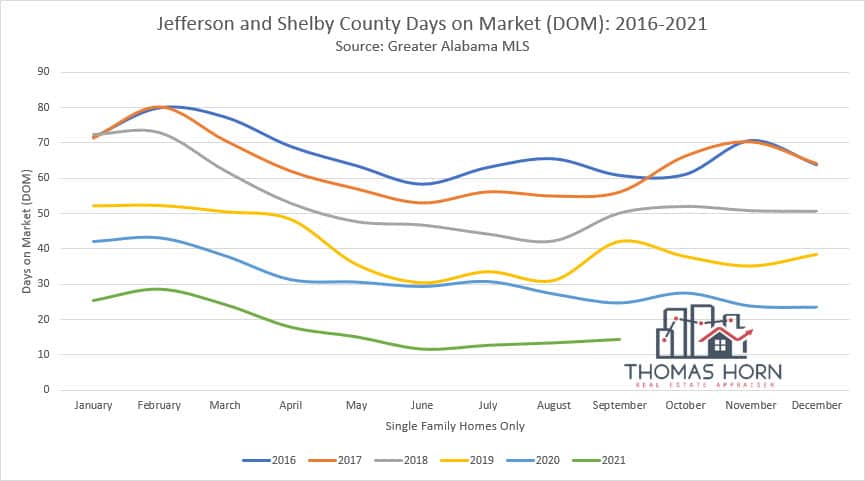
This has resulted in a bigger pool of buyers, however, the inventory of homes has not increased at the same rate. There is now more competition, which has resulted in homes selling faster and the days on market going down.
Four years ago when the market was considered “normal” the days on market hovered around 50-70 days to sell a home. In today’s environment, the average number of days on market is 15-25, a reduction of around 60%.
Number of Active Listings
As I noted previously, the supply of homes has not kept up with the current demand. This is mostly due to the limited amount of new construction we have seen over the past several years.

Due to the number of builders that went under after the market crash that occurred around 2008, I believe banks were hesitant to fund a large inventory of spec. homes for fear that they would be left holding the bag again at some point. Because of this, the inventory of homes did not continue to grow, which we are feeling right now.
The current number of active listings for 2021 has hovered at just under 3,000 homes each month. In 2016 this number was almost double that, which is a reduction of around 100%.
Months of Housing Supply
Tied directly to the number of active listings is the months of housing supply. This is a measure of how long it would take to sell off the current supply of homes, at the current rate of sale, if no more homes were added to the inventory.

This stat helps us to determine whether a market is in balance or if it is considered to be a buyer’s market or a seller’s market. A seller’s market would typically be from 0 to 3 months’ worth of inventory.
A buyer’s market occurs when there is over 6 months’ worth of inventory and a balanced market occurs between 4 and 6 months. In case you didn’t know we are currently in a seller’s market because the months of supply for 2021 have been between 2 and 3 months.
This time 5 years ago it was between 5 and 9 months and in 2019, just prior to the pandemic, it was between 3-6 months. As you can see it has continued to drop over the years and in 2020 with the lowering of rates it resulted in a further reduction.
Question
So would you say we are “back to normal”? I would say no, and in my opinion, it will take a while to get back there given the supply issues and current demand.
A normal market is relative and is influenced by a lot of things. The current Biden administration is introducing additional variables into the housing market which could play an important role in what happens. It will be interesting to see what impact these changes make and whether they will contribute to a normal market.
Do you have any comments or questions about the current market we are in? If so please leave a comment below and as always thanks for reading.
Nice charts and explanations! It seems that lack of supply is the story in most markets. It will be interesting to see if demand slows or supply increases in the future. I agree with you that it will take some time for the supply and demand to be more in balance.
Thanks, Shannon. Yes, I agree that lack of supply seems to be the common thread in most areas. I guess only time will tell as to how we’ll dig out of this hole we’re in.
Love the visuals Tom. They are so clear in helping to illustrate how competitive the market has been this year AND some seasonnal slowing too. Kudos to you.
Thanks, Ryan. You’re right, it’s important to keep in mind the seasonality of the market. As we go into the last quarter of the year we are seeing some slight declines in the number of listings as well as the number of houses sold. This has invariably resulted in the months of supply ticking up as well. Of course, median prices are still going up. It will be interesting to see how the last quarter finishes up.
Are residential appraisers using inflated sales prices at this time to place a market value on a home for purchases and if so what happens to the homes market value when and if the prices of home sales goes back to a more intrinsic market?
Are buyers and sellers considered under distress
Or undue influence based on the current market supply issues and first extreme low interest rates?
You know, Lawrence, those are great questions. I have also thought about this and while what you say makes sense we also have to consider other times there have been drastic changes in the market. After the crash in 2008 the market was flooded with foreclosures which invariably pulled down median home prices. Was this considered at that time? I for sure did consider that when I was performing appraisals. The market is dynamic and it goes up and it goes down and the role of the appraiser is to measure this fluctuation in supply and demand and determine when inflections occur so that we can make appropriate adjustments in our appraisals and know when to use certain sales and when not to.