A Look at the Pulse of Birmingham Real Estate
 The word on the street is that the country may be sliding into a housing bubble. A housing bubble occurs when housing prices continue to rise faster than peoples income.
The availability of cheap money to purchase homes can lead to more buyers and increased competition for homes, which contributes to rising prices. And of course, you have to throw the limited housing inventory into the mix as well.
My appraiser friend, Ryan Lundquist, from Sacramento, CA recently wrote a great blog post where he discussed symptoms of a market that is starting to tank. I thought I would use his suggestions on things to look for and analyze what is happening in the Birmingham real estate market.
I took a deep dive into the housing metrics back in February and will most likely do another in-depth analysis at the end of the year. For now, I thought I would use the metrics Ryan discussed in his article to see where the Birmingham real estate market stands.
Get Local With Real Estate
Not all parts of the country have housing prices rising at the same rates but you can still look at the same type of metrics and get a decent feel for how the local market is doing. The important thing to remember is that because each market is different we shouldn’t just go with what the national news is saying and infer that our local market is performing the same way.
We all know that real estate is local so we must study the numbers in our area to get an accurate read. Let’s take a look at the local Birmingham area and see how the numbers look.
Housing Inventory
The first thing to look at is changes in inventory. We don’t want to confuse seasonality with larger changes in the market so it’s a good practice to compare each month over the previous year.

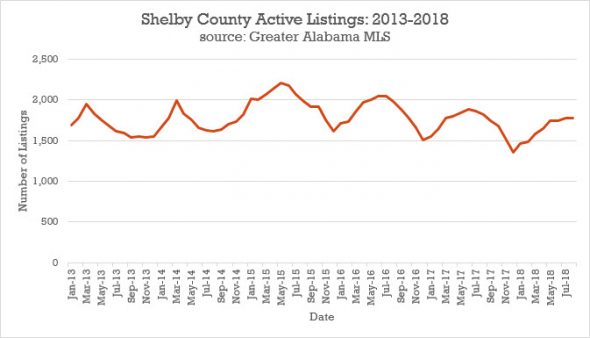
For Jefferson County, housing inventory is actually down a whopping 22% for August of 2018 compared to last year at the same time and Shelby County is down a modest 3%.
We do see some seasonality in active listings for Jefferson and Shelby County, which is typical. While Shelby County does have less overall listings than Jefferson County the overall trend is pretty level, however, Jefferson County has seen steeper declines in active listings since mid 2015.
In a softening market, we would see inventory levels rising but this is not the case. A shortage of listings makes this a seller’s market and we’re seeing this with aggressive pricing and multiple contracts on homes.
Sales Volume
Throughout the year we’re going to see sales volume rise and fall, and this trend is typically the same year in and year out. Here are 5 years of sales for Jefferson and Shelby counties.


So, what do we see? August sales volume in Jefferson County is down nearly 20% from last year while it’s less than 1% for Shelby County. This is a normal consequence of a decrease in inventory. Fewer homes listed results in fewer being sold and there is no reason to be alarmed.
One anomaly I noticed in the greater Birmingham area and over a larger time span was sales holding steady or slightly increasing. I attributed this to the market becoming more efficient with more homes that were listed actually being sold and not being withdrawn, canceled, or expiring.
Changes in Median Price
If we now look at trends in the median sold prices we can see what effect a decline in inventory is having. As you might expect, the decline has resulted in median prices increasing.
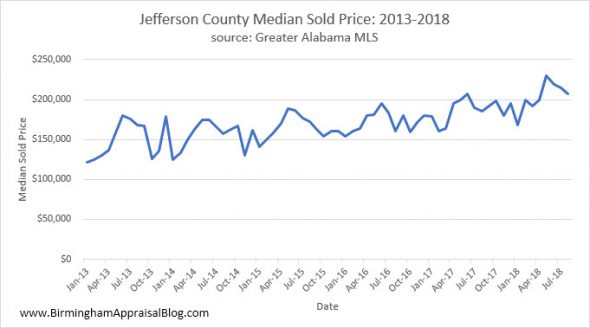

Jefferson County has seen an increase of over 11% in median sales price from August of 2017 to 2018 and Shelby County is at about the same amount. Again, this is a normal reaction to declines in inventory. Prices are increasing as a result of good demand and limited inventory.
Local Wisdom
So now that you’ve looked at the numbers what do you think? I took an informal poll to see what Birmingham locals thought of the market and here’s what I found.
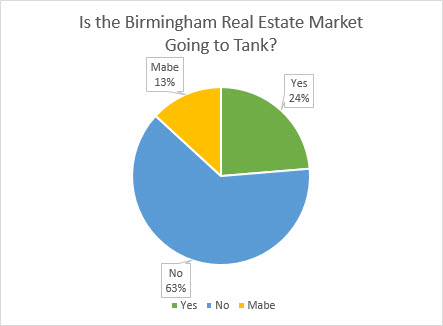 While this is not a statistically significant study due to the limited amount of participants, it looks like the majority of people in the know around Birmingham think the local market is doing pretty good. This is important because they work in it every day and can give a better read than someone halfway across the country.
Conclusion
If you want to know how the Birmingham real estate market is, don’t read the national studies or listen to someone that isn’t in the area. Stay local and pay attention to the people who keep up with the numbers. If you have any questions about the Birmingham real estate market feel free to subscribe to this blog where I provide periodic updates on the overall market as well as neighborhood sales stats. As always, thanks for reading.
If you liked this post subscribe by email (or RSS feed). Thanks for visiting.
Love the graphs Tom. Excellent work. You do a great job telling the story of value to your market. Seriously good stuff.
Thanks, Ryan.