Eagle Point Real Estate Update
The Eagle Point subdivision is located in north Shelby County just off of Highway 280. The subdivision was started in the mid-1980s and is one of the more popular neighborhoods in North Shelby County.
The neighborhood features a swim and tennis club as well as various private lakes. A new sector of the subdivision was recently created when the Eagle Point golf course was closed several years ago and the land was converted to residential use.
I’ve performed countless appraisal assignments in Eagle Point over the years and thought I would share some market data that I came up with during a recent job I was working on.
From data supplied by the Greater Alabama MLS, the following statistics reflect sales activity from 1999 through 2020. The study of price per square foot runs from 2010 to 2020 as that is when the MLS started reporting the square footage of homes.
Home Sales By The Numbers
Sales Price Trends
The first chart shows the trend in home prices over this 20+ year period. With the exception of some outlier sales, there is a definite pattern in the price trends.

Something that I found interesting is the density of sales around the year 2000 and then again in the past 2 years. There is currently an upward trend in home prices as well as an increase in the number of homes sold, which is helped by the new construction that has occurred due to the conversion of the golf course to single-family housing.
Takeaway: This is positive news for sellers as there is strong demand and home prices are trending upward.
Average Price Per Square Foot
Price per square foot can be a good indicator of the direction home prices are taken but should not be relied upon to price homes unless there is a high degree of comparability in the sales.
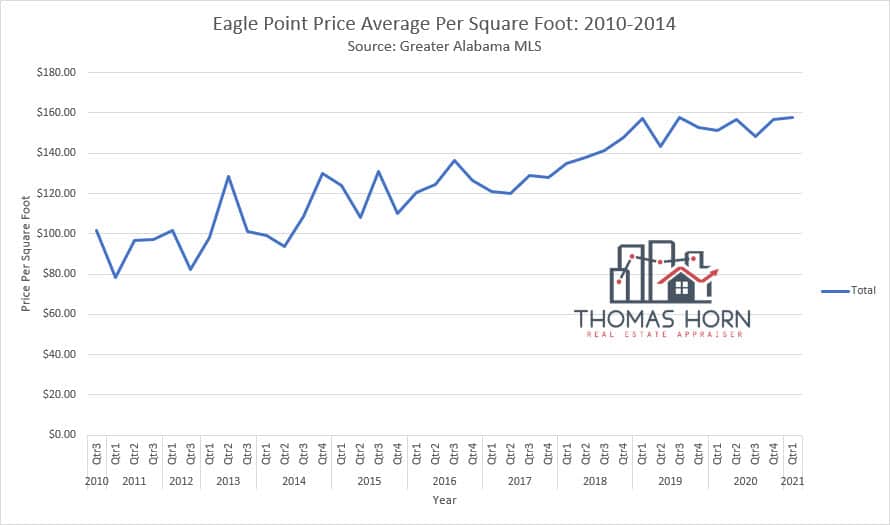
As a whole, there has been a steady increase in the overall average price per square foot. Certain price ranges may experience more or less increases depending on how much demand homes within the price range have.
The Greater Alabama MLS started reporting square footage around 2010 so that is where our data for price per square foot begins. Even though the square footage is now reported it is not always the most accurate and should be verified.
Takeaway: Be careful when using price per square foot to determine home values unless the sales used are very similar to the subject property.
Average Days on Market
The overall trend for days on market in Eagle Point has steadily decreased with the current days on the market being as low as its ever been. There is no surprise here because unless you’ve been living under a rock you’ve heard about how low inventory is and when this occurs days on market typically declines.
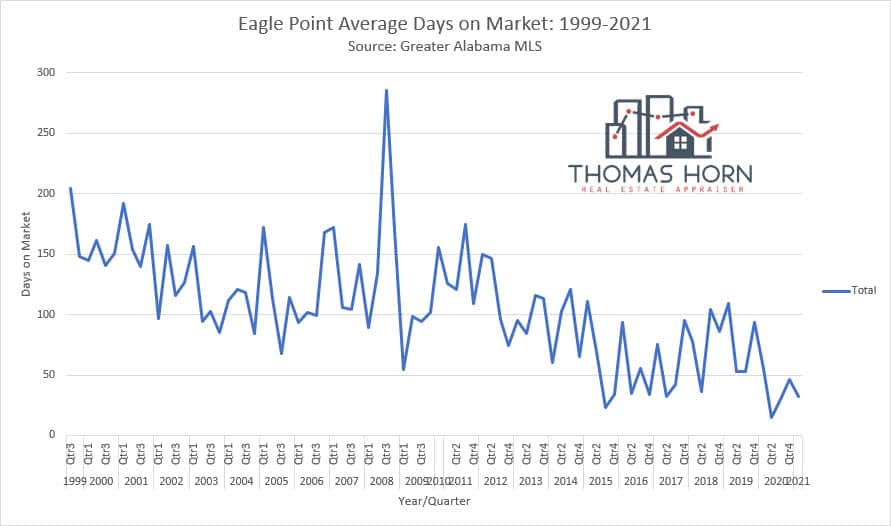
The average days on market for all of 2020 was approximately 33 days. If you want to sell your house and you price it to the market it shouldn’t take more than about 33 days to sell it.
Takeaway: You can sell your home quickly if it is priced to the market. Take this into consideration when planning your move and the purchase of your next home.
Sale Price to List Price Ratio
The Greater Alabama MLS reports that in every quarter of 2020 the average sale price to list price ratio of homes sold in Eagle Point has exceeded 100%. This means that the final sale price was higher than what it was listed at.
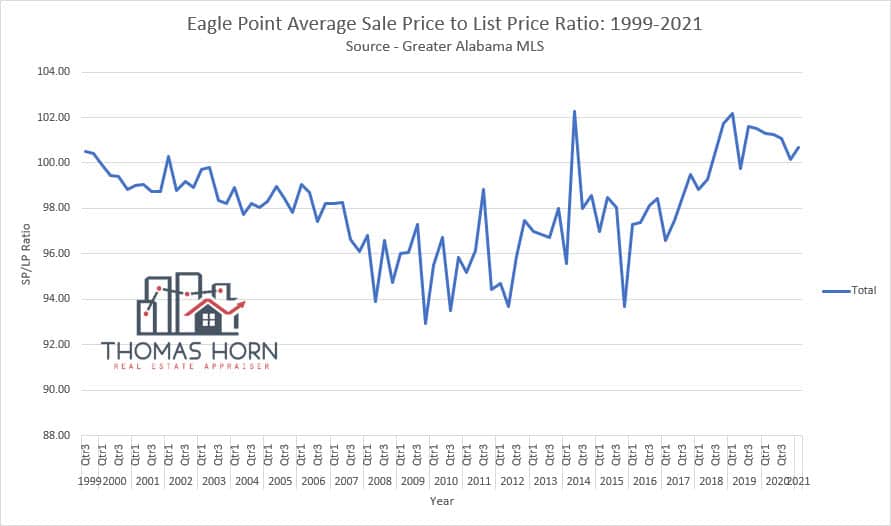
Does this mean that every home sold for more than what it was listed for? No. It does mean, however, that generally speaking the majority of buyers did pay more than the list price most likely due to the limited inventory and their desire to not lose the deal.
Even though the home may have sold for more than it was listed at this does not always mean that the home appraised for the contract amount. I wrote about this last week if you want to check that out.
Takeaway: As I just stated, not every home will appraise for the contract amount especially when it is above the list price. There are several options available to you when this happens which I discussed in last week’s post.
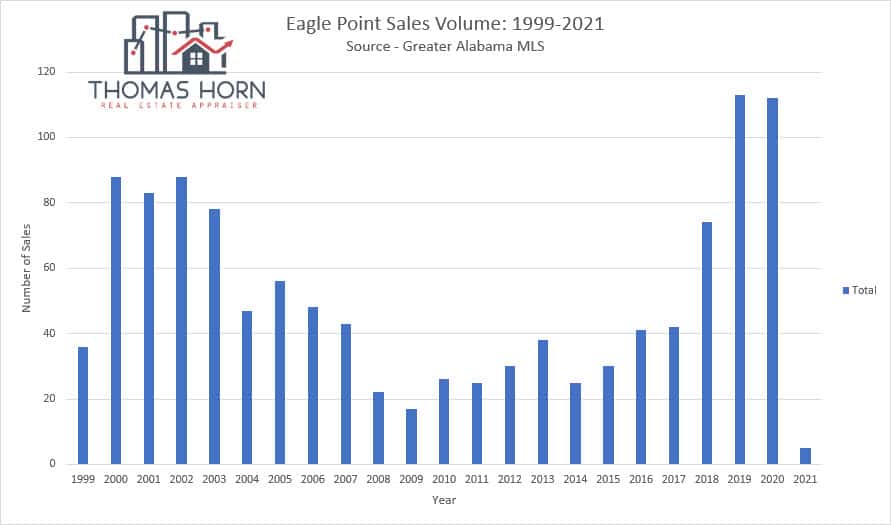
Number of Sales
There were approximately 112 homes that sold in Eagle Point in 2020, which was very similar to 2019. This was a big increase over 2018 when only 74 homes sold. This large increase is most likely due to the new construction that has occurred due to the golf course being shut down and developed with single-family homes.
Takeaway: The limited inventory typical of today’s market was alleviated somewhat by new home construction. If you are selling your home you need to have it in tip-top condition to compete with new construction.
Eagle Point Active Listings
At the time of this writing, there were approximately 42 active listings, ranging in price from $382,000 to $545,900. Pending and contingent listings consist of 37 homes ranging in price from $382,000 to $545,900
Conclusion
As I noted previously the Eagle Point neighborhood is a popular area and the above statistics reflect all sales. Certain price ranges may reflect different numbers. As an example, as the size of the home increases, the price per square typically goes down, if all else is equal, so the average price per square foot for a certain price range home may vary. There is a wide range of variables in this area with some homes being on waterfront lots and others on the interior.
Price levels have been increasing over the last several years, however during the last quarter of 2020, and the last several months, the average prices of home sales per quarter were in the range that has not been seen since the real estate crash of 2007-2008. This positive direction in price levels is expected to continue barring any unforeseen circumstances.
Question
If you have any questions about sales in the Eagle Point subdivision or you need a pre-listing appraisal, feel free to get in contact with me.
Love it Tom. I was taken aback with your scatter graph as you can really see a change in volume lately. Lots of dots. Then of course your bar chart shows volume changes too. I think one of the most telling stats of the temperature of the market is the SP/OLP ratio. Great stuff here.
I agree, Ryan. Normally the scatter patterns are just that, scattered, with no noticeable differences in density. With this one, it is more pronounced and visible. The SP/LP ration really surprised me with the number of homes being sold over the list price.
Hi Tom,
Nice summary. Do you think some of the price increase recently could be from an increase in reported new home sales?
Yes, Joe, I think that was a big part of it. Demand is so great here and inventory is so low that whenever a new home is put on the market it gets snatched up. I’m sure that is the same in most areas across the country.