Is Alabaster housing on the upswing?
With Spring in full bloom and Summer approaching I thought I would take a look at how the Alabaster housing market is doing. People have been asking me how home sales compare to past years so today I’m going to share with you what I found. By the way, this information was taken from the Birmingham MLS as of the date of this post. I hope this answers any questions you may have regarding how Alabaster home sales in the first part of 2016 compare to past years. Please leave a comment below and let me know your thoughts.
The BIG picture
To start with, I thought I would take a look at the big picture by seeing how Alabaster housing in the first part of 2016 compares to past years.
Number of Home Sales- The first graph below shows number of homes sales by quarter going back to 2000.
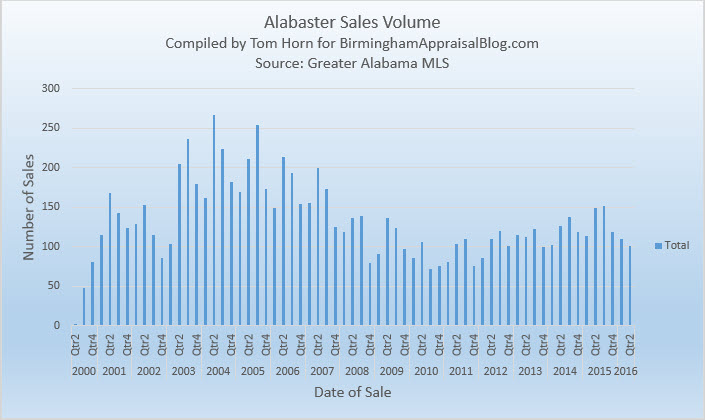
Sales volume peaked during the years from 2003 to 2006 with the most sales occurring during the second quarter of 2004 with 267 sales. There were fluctuations after this with noticeable declines starting in 2007, which by the way was when the real estate market crash first started to occur.
Sales Price Holding Steady- The graph below shows home sales by price during this time period.
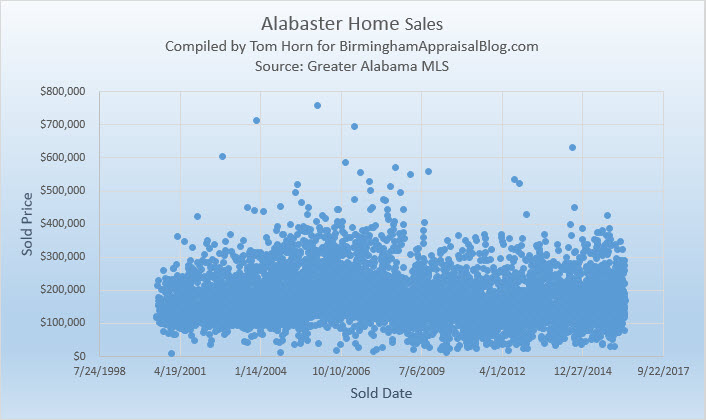
Something that stands out to me is the overall stability of house prices. Many of my appraiser friends from other parts of the country also publish sales graphs from their area and you can see a distinct change in prices starting before the crash and continuing on to current day.
With Alabaster housing trends there is no big change. We did have some outliers here and there that sold for more than typical but overall pricing has stayed steady. I believe that this is a positive reflection on the stability of our area. Our market never did have the steep increases in sales prices that areas like California and Florida had. Our prices have always been pretty stable. This is not to say that certain sub markets did not suffer more than others because they did. Overall Alabaster, and the Birmingham area in general, held up pretty well through the real estate crisis.
How Long Does it Take to Sell Your Alabaster Home?- The time it takes to sell your home is important. The days on market, or DOM, is a measure of how long it takes to sell your home from listing to sale. A high DOM reflects a home that is priced too high and/or there is an oversupply of inventory. A low DOM may indicate a home sold with increased motivation or a situation where demand is higher than the available inventory.
This number can be effected when a home is continuously listed and relisted. An example of this would be a home that is listed higher than it should be. When this is done it will sit on the market and not sell, which increases the DOM. The home can be removed from the market and then relisted at a lower price, which may result in it selling. The DOM that is recorded in the MLS is the latest DOM and does not include the previous listing that was priced too high.
It’s important to know that pricing your home at the right amount will result in it selling within a reasonable time. The graph shown below reflects the DOM of the latest listing for homes that sold since 2000.
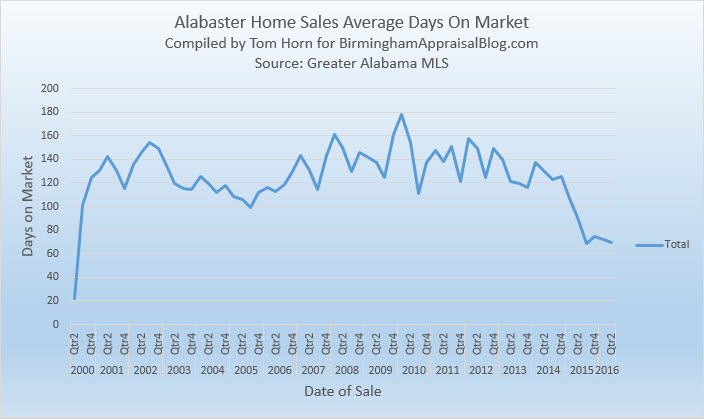
There’s been an overall steady decrease in DOM since 2013 which reflects a decrease in inventory that leads to homes selling quicker.
Alabaster Housing: 2015 vs. 2016
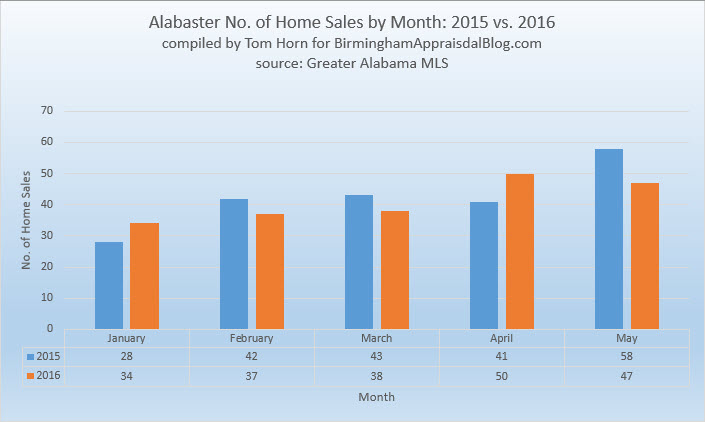
How many homes are selling in Alabaster?
The big talk these days is about the lack of housing inventory. If we look at the chart shown below we can see this to be true in 3 out of the first 5 months of 2016 compared to 2015. In 2015 there were 212 homes that sold from January through May compared to 206 in 2016.
Low inventory causes prices to increase
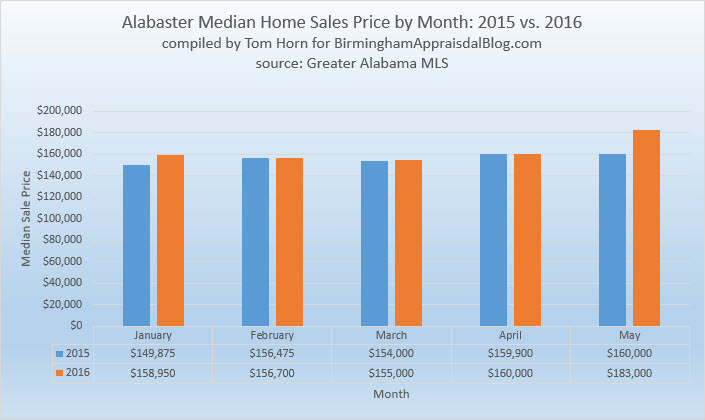
If we consider the basics of supply and demand we can predict that if demand stays the same or increases and supply is limited then prices will most likely increase. The chart below compares the median sales price of homes from January through May for 2015 and 2016. The median sale price of homes was higher every month in 2016 compared to 2015, with the biggest difference occurring in May where there was a $23,000 spread.
Alabaster Housing Market Summary
The current Alabaster housing market is not quite at the level we were during the peak years prior to the real estate crash. In terms of the number of home sales we are tracking at about the same level were were in 2002 and also 2009 when we started to show signs of recovery after the crash. The number of sales has fluctuated based on inventory levels. Sales price levels are at approximately where we were at in 2004 and 2005, just prior to the rise in levels that occurred before the crash.
While there have been some higher outlier sales, the overall real estate market in Alabaster has been relatively stable, which is a positive sign. When comparing 2015 to 2016 we see that housing inventory is less this year which has caused median sales price levels to increase in 2016. Due to lower inventory levels now is a good time to put your home on the market, however choosing the right price is very important. If you don’t price correctly your home will sit on the market longer than it should. If you have any questions about where you should price your home feel free to give me a call.
Questions
If you have any questions about Alabaster housing or what is involved in getting an appraisal leave a message below or give me a call. As always, thanks for reading.
If you liked this post subscribe by email (or RSS feed). Thanks for visiting.

Great job giving us a picture of the Alabaster housing market Tom.
Thanks Gary.
Great stuff, Tom. I loved all the graphs and how visual your presentation was. It looks like the market has been pretty flat, though lately it has taken less time to sell and there was a slight uptick in the median price last month. Nice work.
Thanks Ryan. The graphs do provide a great visual to show that we haven’t had any drastic variations.