Tracking Birmingham Home Sales During The Pandemic
We are now approximately six weeks into the COVID-19 pandemic. Most experts agree that when the country started closing down the week of March 9 this marked the beginning of a national emergency.
The national emergency, along with the restrictions on large gatherings of people, effectively crippled large sectors of the U.S. economy. We are still monitoring the effects of the pandemic on the real estate industry and this week I would like to share some of the latest data for the Birmingham, AL housing market.
I am including charts I put together that help tell the story of the Birmingham real estate market. As you know, real estate is location-specific so it is important to drill down to the local market.
While we can get a general idea of the real estate market by listening to national news it really doesn’t tell the story at the local level. The charts I am sharing here cover Jefferson and Shelby counties in Alabama.
Certain neighborhoods may perform better or worse than others in the Birmingham area so to find out about a specific neighborhood or subdivision it would be necessary to analyze sales from that location. The information in this post gives a general picture of the overall Birmingham Market.
5 Charts That Describe The Birmingham Housing Market
1) New Birmingham Home Listings in 2020 – The number of new listings in the Birmingham metro area has declined slightly beginning around the last week of February and the first week of March. At first, this would seem to be a negative reaction to the pandemic, however, this appears to be normal when you compared 2020 to 2019.
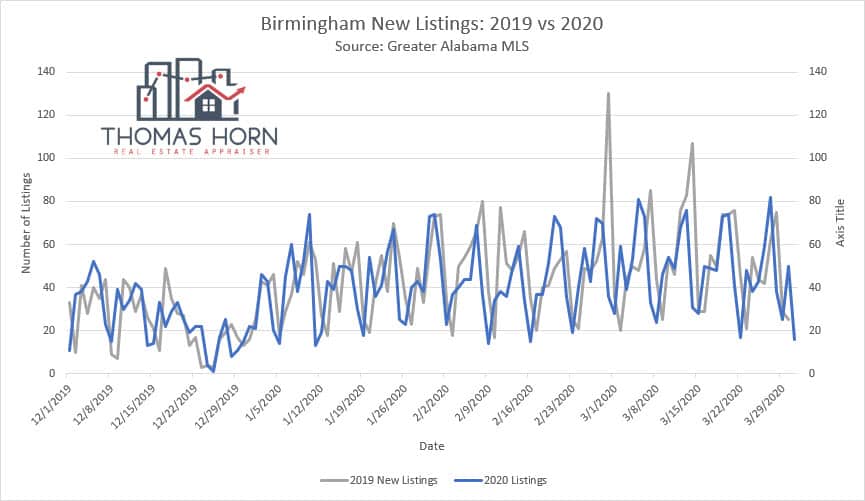
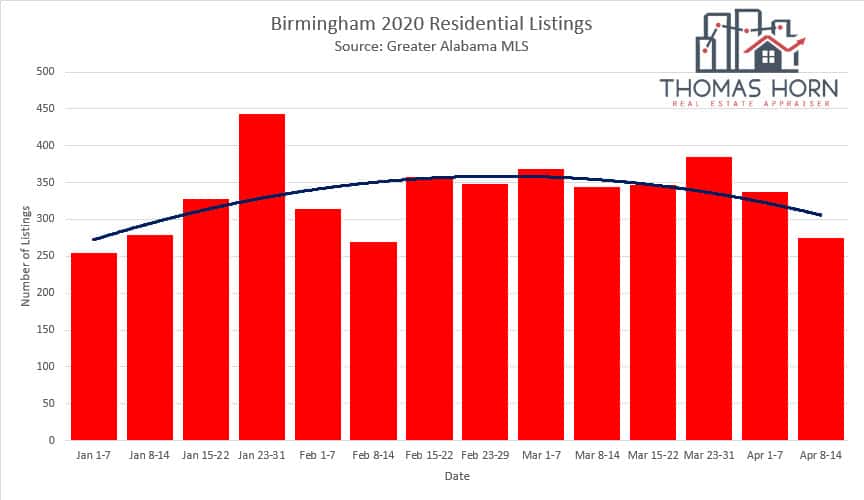
It is important to remember the various seasonal fluctuations of listings throughout the year. During the spring season, we typically see a gradual increase in listings as sellers put their homes on the market in the hopes of selling during the most active time of the year.
If we continue to see a drop in new listings this will contribute to a seller’s market because of limited supply. The next several weeks will help us to see if the pandemic is causing sellers to push the pause button until things look more stable or if the natural rhythm of the market continues to track normally.
2) Birmingham Canceled Listings – Looking at canceled listings can help us to see if sellers are reacting negatively to what is going on. An increasing trend of cancellations might indicate that sellers are unsure of the market.

What we are seeing in the Birmingham real estate market is a peak of cancelations in around the beginning of February and then a gradual decline. This is not what you would expect if Birmingham area sellers were negatively influenced by the COVID-19 pandemic.
I credit local agents who are embracing technology and promoting virtual tours and other methods of interacting with buyers and sellers.
3) Birmingham Homes Temporarily Taken Off The Market – While canceled listings are not showing any increases, listings that have been taken off the market temporarily have increased since March. The good news is that it peaked towards the end of March and has started to decline.

Keeping up with listing stats requires daily and weekly tracking because it can change quickly. The important thing to keep an eye on is the trend over time. Again, if listings start trending up again then this will affect supply and demand.
4) Birmingham Pending Sales – Next to actual closed sales, pending sales are important to keep up with since they will be the new sales we analyze to keep up with the market. The Birmingham market has seen a slight downward trend in pending sales since the beginning of March.
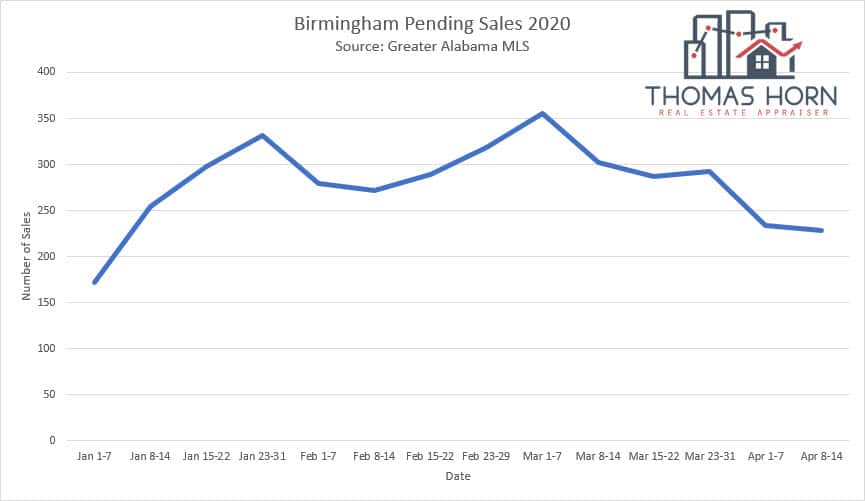
The downward trend may be tied directly to the slight decline in listings. What will be important to keep an eye on is if new listings increase and pending either doesn’t move much or continue to drop. This may signal a softer market and move towards a buyers market. I don’t expect this to be the case, however, it is important to know the possibilities and be prepared for the market by adjusting our marketing efforts.
5) Sales Volume: 2019 vs 2020 – Another way of looking at the health of the local Birmingham real estate market is to see what is happening with sales volume, or the number of closed sales. Up until the end of February and the beginning of March we were seeing a trend of more sales for 2020 over 2019, however, this trend ended around the middle of March.

At mid-March sales volume dropped to below 2019 levels. Of course, these sales were those listings that were under contract at the beginning of the year.
This trend has continued through April 17, 2020, and I will continue to track it as the pandemic progresses. Keeping an eye on these trends will help buyers and sellers to stay informed so that they will know what type of strategies to use when buying or selling a home.
Key Takeaways From These Trends
- The trend for new listings entering the market is tracking similar to last year although at a slightly lower number.
- Sellers are not freaking out and canceling their listing, however, some are taking a wait and see attitude as indicated by some homes being taken off the market temporarily.
- Pending sales are starting to see a slight downward trend. The next several weeks will help us to determine if this is just a natural part of fluctuations in the market or if we are seeing potential negative effects of the COVID-19 pandemic. I have seen more extreme fluctuations in other markets across the country. The Birmingham real estate market has always been more stable than others around the country, however, we have not seen the extreme highs and lows like those markets experience.
- The overall sales volume through April 17 for 2020 is similar to 2019. Sales volume through March of 2020 was surpassing the same period in 2019, however, it started dropping off in March and we have seen fewer sales overall compared to 2019 from March through April.
Question
Do you have anything to add or any questions about what direction the Birmingham real estate market is taking? If so please leave a comment below and as always thanks for reading.
Just posted a link to this on my Facebook page. Well Done!
Based on Johns-Hopkins/CDC data that I have summarized during the past few weeks, Alabama’s contagion rates are linear, not exponential, and are now trending downward. This whole lockdown was overblown, I’m thinking.
Thanks for sharing!
This is very helpful. Great job.
Thank you.
Thanks for your help, Tom ! This is very helpful.
Thanks, Marcia.
Good insight into the market. We are seeing similar trends. What are seeing with regard to the acutal sales prices? How are they trending in this time period. Stable, Up, down? Thanks Tom.
So far prices have not changed much. Listings are still going for near list price without much softening of the market and homes are selling quickly.
Great analysis Tom. It’s fascinating to see your market. So far your area doesn’t look like some of what we’re seeing in other places with a huge difference in new listings and such.
You’re right, Ryan. When you started publishing information about the Sacramento area I thought we might see something but so far that is not happening. This really makes sense though because the Birmingham real estate market responded differently to the 2008 recession also. Out market took longer to see the effects and our changes were not as drastic. We’ll see if this pandemic affects the market in a similar manner.
Nice work Tom. I’ve been reworking my market conditions comments on weekly basis, and in some cases, on a appraisal-by-appraisal basis. I think my initial statement which was basically that it was too early to tell still applies, though I have polished it up and spun it into a couple of paragraphs by now.
I agree, Tim. I think our area is unique in that it is pretty stable so we have not seen any drastic fluctuations like other areas. I’m keeping an eye on it though in case things change.
Great post Tom. Clear evidence of what’s happening in your market.
Thanks, Joe.