Appraisal Blogging and Birmingham Home Sales-Then and Now
 This year marks the 10th anniversary for my appraisal blog! I’m super excited to celebrate the opportunity I’ve had since 2010 to share my appraisal knowledge with real estate agents, mortgage loan officers, attorneys, accountants, and homeowners about the appraisal process and local Birmingham home sales trends.
My goal from the start has always been to be as transparent and straightforward as possible about the appraisal process. I want to explain why and how appraisers do what they do.
Since 2010 I have written over 500 blog posts to help answer questions the public has about the real estate appraisal process. In addition, I have shared my market research about neighborhood sales statistics and general Birmingham home sales trends.
The Birmingham real estate market has changed over the past 10 years so today I thought I would look back at sales trends in 2010 compared to the past year.
I thought it would be interesting to compare and contrast the difference. It will be interesting to see what 2020 holds for us. It’s a new year and a new decade but I believe it holds a lot of promise.
Please feel free to share in the comments section below anything positive you’ve gotten out of my blog or just let me know if you like to read it. I’d love to hear from you.
Birmingham Sales Trends: 2010 vs 2019
When I began blogging about the Birmingham real estate market in 2010 we were in recovery mode from the crash that occurred in 2007-2008. The median sale price for homes in Jefferson and Shelby county had dropped off considerably from pre-recession highs.
One reason for this was due to the increase in foreclosure sales. Once the exception they were now the norm. Take a look at this comparison from then and now.
This increase in distressed properties had to be considered when appraising during this time period. They made up a larger percentage of sales and were influencing prices.
The foreclosures that were for sale were not your typical trashed out property. They were nicer properties in popular areas that were competing with all of the other listings.
The good news is that these types of properties are now the exception because the market has returned to normal. They are now not given much consideration because of the larger number of non-distress sales.
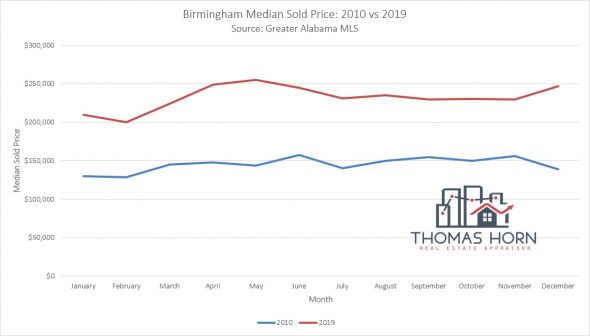
Because of this the median sold price has increased. The chart below compares the median sales price trend throughout the year in 2010 and 2019. It shows what has happened to the median sales price for homes in Jefferson and Shelby counties.
The median sold price for homes in the Birmingham metro area is now at one of the highest levels ever. If you are selling this is good, however, buyers are now paying more for homes than in the past.
Besides the lack of foreclosures having a positive impact on prices, there is also another factor. Low inventory levels are affecting supply and demand and helping to drive prices up.
While the total number of homes sold in Birmingham during 2019 is higher than in 2010 the months of inventory is lower because the number of buyers has increased. The chart below shows Birmingham home sales volume in 2010 and 2019.
The months of supply has decreased dramatically. Due to the limited inventory and increased demand, the stock of existing homes that are currently for sale will be depleted a lot sooner than they would have been in 2010 unless more homes are listed for sale. It is not uncommon for real estate agents to post their need for listings in specific areas of town to help meet their buyer’s requests.
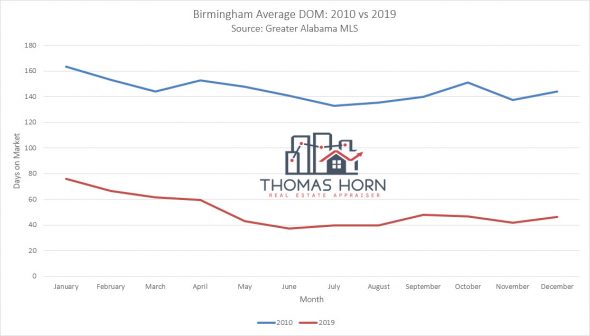
The last two stats that I’d like to mention are the days on market and the sale price to list price ratio. These two numbers are good for sellers to know because it will help you in pricing your home for sale. Notice the gap between 2010 and 2019 for the days on the market?
If the average days on market is higher than typical like it was back in 2010 then that is one indicator of a soft market. Because there is more inventory and fewer buyers you have to make sure the home is priced accurately or it will take a long time to sell.
The current real estate market in Birmingham is the opposite of a soft market because the DOM has declined so much. Due to good demand and limited inventory, it is a seller’s market and the DOM is at one of its lowest levels ever.
If you price your home accurately you can sell it pretty fast and for a good amount. The key phrase here is “if you price your home accurately” because even though inventory is limited buyers still want to know they are not overpaying.
The last metric we’ll look at is the sale price to list price ratio. The final sale price is divided by the list price to arrive at a percentage with a higher number closer to one being good. Again, comparing 2010 to 2019 is like comparing night and day.
Check out how big the difference is.
The fact of the matter is that if you price your home to the market then the final sale price will not have to be reduced much to sell it so the sale price to list price ratio will be closer to “1”. Lately, it has been in the 97% to 98% range unlike in 2010 when it was approximately 10-15% lower.
Lets Connect
So there you have it, a comparison of the Birmingham real estate market when I began blogging to now, entering my 10th year. As I said, I love helping others online through my blog but better than that I love connecting with people offline.
If I can help you learn more about the appraisal process or educate you about trends in Birmingham home sales please let me know. One of my goals for 2020 is to make more offline connections so let’s get together this year. I’m always available to speak at local real estate offices to inform and educate agents. As always thanks for reading.


Congratulations on 10 years of blogging! You have such a great blog, so consistent with relevant information. Thanks for all you do!
Thanks, Shannon!
Always enjoy your appraisal / real estate blogs. Very insightful & well-written.
Thanks, Andy, I appreciate it!
Great information as always Tom. Congratulations on the ten years of being a resource to your local Real Estate community-that is quite an accomplishment!
Thanks, Mark, I hope you are doing well.
Congratulations on the ten years of blogging!! That’s a huge accomplishment. I really like the way you juxtaposed then and now in the images. I hadn’t thought of showing visuals that way before. I’m going to have to try that. I tend to simply show ten years on one graph instead of two separate trend lines. Hmm… Thanks for the idea.
Thanks, Ryan, I appreciate it. Thanks for your thoughts on the graphs. I thought it would help to highlight the differences between the two time periods.
Happy anniversary! What an awesome accomplishment! I have always enjoyed reading your blogs. The information you share is very helpful and is an excellent resource for the public. Here’s to another 10 years!
Thanks, Jamie. I hope you had a great Christmas and a Happy New Year.