A look back at Alabaster home sales in 2016
 With 2016 behind us and 2017 ahead of us I thought I would take a look at how Alabaster home sales performed in 2016 compared to past years. Alabaster has seen steady increases in the number of sales as well as prices over the past 5 years. Let’s break the numbers down for 2016 and see exactly what happened.
Alabaster home sales in 2016 saw a modest increase of 3 units over 2015
at 534 homes. The median sales price rose 6% over 2015 at $167,925.
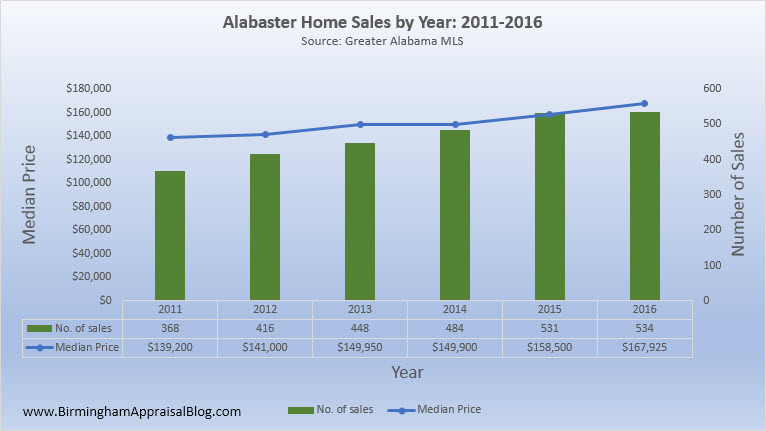
Looking back at sales volume over the past 5 years we see that the number of homes sold in 2016 has increased by 45% since 2011. That translates to 534 single family home sales in 2016. The median price over the same time period went from $139,200 to $167,925 for an increase of approximately 20%.
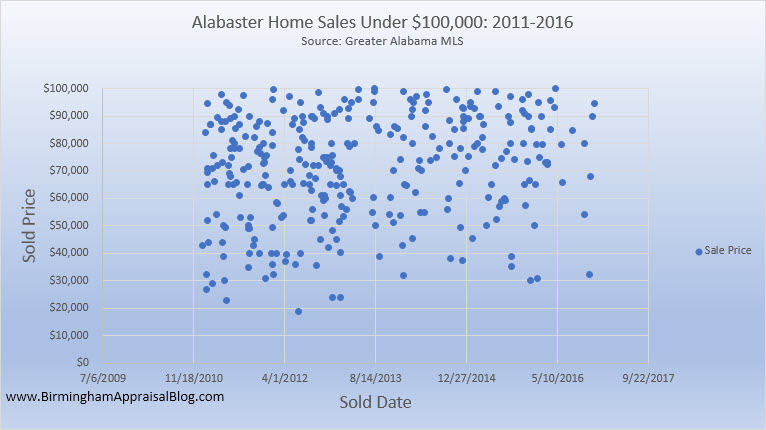
These increases were highly impacted by both the decrease in home sales under $100,000 and the increases in homes sold over $300,000. Another factor that probably influenced this was a decreasing inventory of homes that put sellers in the driver’s seat making it possible for them to ask top dollar for their homes.
The graph below shows a slight decrease in the number of sales for homes under $100,000 from 2011 to 2016.
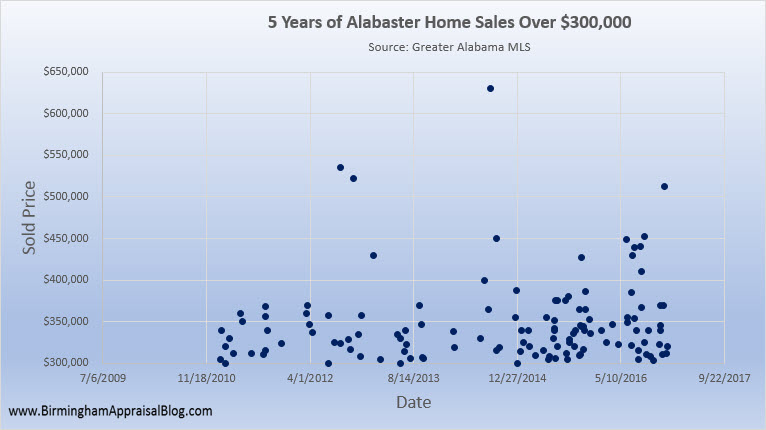
And the next graph shows a gradual increase in those sales over $300,000.
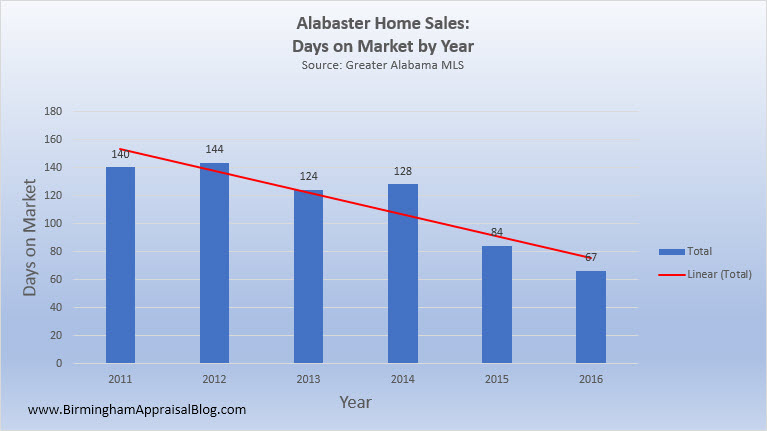
This was also played out in the number of days it took to sell a home. With decreasing inventory there are less choices for buyers and the homes that are available are snatched up a lot quicker than when there is a more plentiful supply of homes.
The average days on market (DOM) decreased in 2016 to 67 from 84 in 2015. Looking back over the past 5 years we see a 52% decrease from 140 days in 2011 to 67 in 2016.
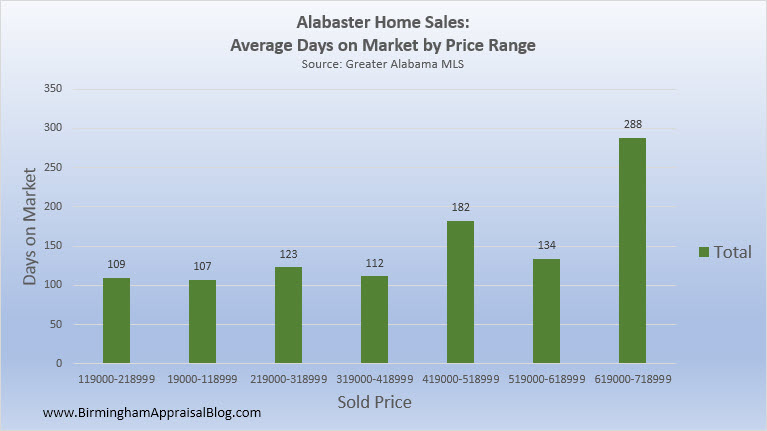
Speaking of days on market. It is interesting to break this metric down even more by price range. If you are a seller or an agent and have a home priced at the upper end of the range then expect for it to take longer to sell as you can see from the graph shown below.
Alabaster home sales by subdivision
So where did all of the Alabaster home sales occur in 2016? Breaking it down by subdivision you can see that Lacey’s Grove had the highest number of sales with 38. This subdivision is located off of Shelby County Road 261 next to Creekview Elementary School. The average sales price in this neighborhood was $221,438.

The neighborhood that had the highest average sales price was Grande View Estates with a price of $261,184. Grande View Estates had 23 sales in 2016. It is located off of Shelby County Road 12 and is in the Maylene community. Both of these subdivisions have new construction.
The top 10 list of Alabaster home sales by subdivision, with the number of sales is as follows:
- Laceys Grove-38
- Sterling Gate-36
- Weatherly-25
- Lake Forest-25
- Grande View Estates-23
- Navajo Hills-19
- Southfield Gardens-18
- Stagecoach Trace-18
- Stoney Meadows-16
- Park Forest-15
Questions
So what do you think about my recap of Alabaster home sales in 2016? If you are a buyer or seller do you live in one of these top subdivisions? If you are an agent is there anything you would like to add? What are you seeing out there? Are you seeing the same thing these graphs show? Leave a comment below and let me know your thoughts. As always, thanks for reading.
If you liked this post subscribe by email (or RSS feed). Thanks for visiting.
Wow Tom. I really like your graphs. I’m always intrigued to see the market in different ways, and I love the presentation. Fantastic work!!
Thank’s Ryan. I can honestly say that seeing how you “tell the story of value” using graphs inspires me to do the same for those in my area who are interested in seeing how the market is doing.
Thank you for sharing all these home sales statistics on Alabaster. Appraisers, real estate agents, and homeowners in Alabama all could find this useful.
Thanks, Gary.