Jefferson & Shelby County Sales Trends
The first quarter of 2018 is now history so I thought I would take a look at how Birmingham home sales for 2018 in both Jefferson and Shelby County were affected by the housing shortage and see how they stack up to past years. I’m going to be looking at several key stats, including the number of homes sold, median sold price, days on market, the number of active listings, and months of supply.
The topic on everyone’s mind is the housing shortage. It’s interesting to look at how the shortage affects the market because as appraisers we have to know what is going on since sales prices are directly related to supply and demand.
Seasonality
Real estate is seasonal throughout the year. Take a look at the charts below and you’ll see what I mean:


The first bar is January, the second bar is February, and the third is March. See a trend? January sales are typically the lowest during the first quarter with each subsequent month increasing. It’s important to recognize this so you know what to expect. You really don’t need to get excited about the increase in sales from January to March since that is always going to occur but instead compare these numbers from the previous years to see how the market is doing.
The real estate recession occurred in 2007-2008, and as you can see the number of sales started declining, with a low point in 2012. Since then the number of home sales has increased and we are approaching pre-recession numbers.
Median Price
To get a reliable indication of how sales prices are doing it’s helpful to look at the median sales price trend. It’s not surprising, given the current supply and demand characteristics, that the price trend is increasing. The median price gives a more reliable indication compared to the average price because it is not affected as much by the high and low prices.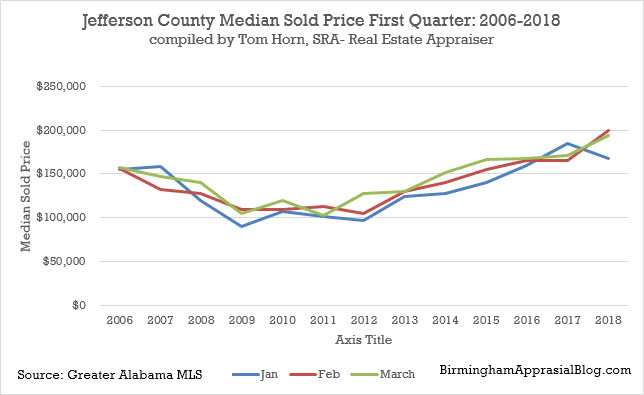
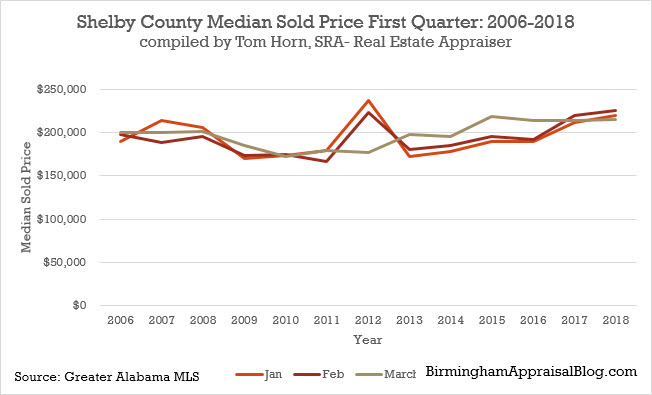
Prices in Jefferson County are at their highest point since 2006, while Shelby County is about even with prices in 2007. Median prices in Shelby County spiked in 2012 due in part to inventory bottoming out. This low inventory resulted in buyers making higher offers in order to get the house they wanted. Median prices in Jefferson County have bounced back the most with an increase of approximately $50,000 in median prices since 2006.
Days on Market
As you might expect the days on market for both Shelby and Jefferson County have seen a gradual decline. This is expected when inventory levels are low since buyers do not have as many choices and they are eager to make an offer.
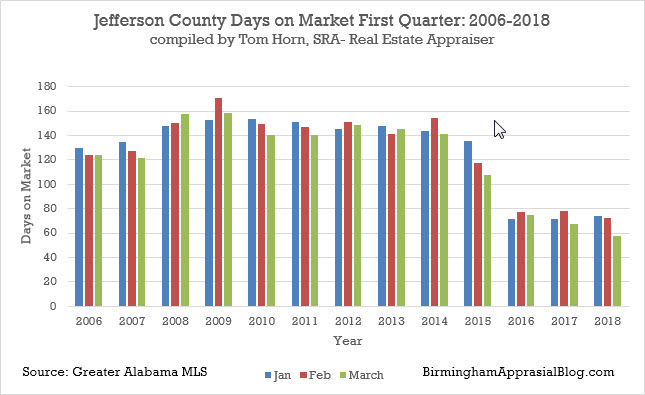

If this trend continues buyers will need to keep this in mind and not take too much time when making an offer or else they could lose the house they want.
Active Listings
This next stat is very telling when considering the current housing market. It’s a well-known fact that the number of houses actively listed for sale across the country has steadily decreased and Birmingham is no different.
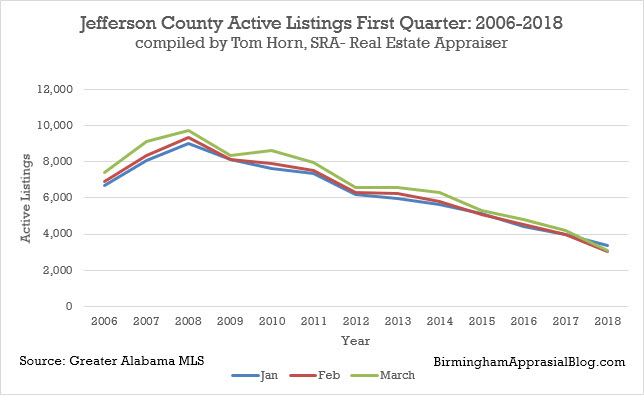

The number of active listings is at their lowest level since 2006, for both counties. There is some indication that we could see some slight increases in the number of houses for sale due to new construction activity in various areas of Jefferson and Shelby County.
Months of Supply
The months of supply is following the active listings trend because it is also declining at a steady rate.
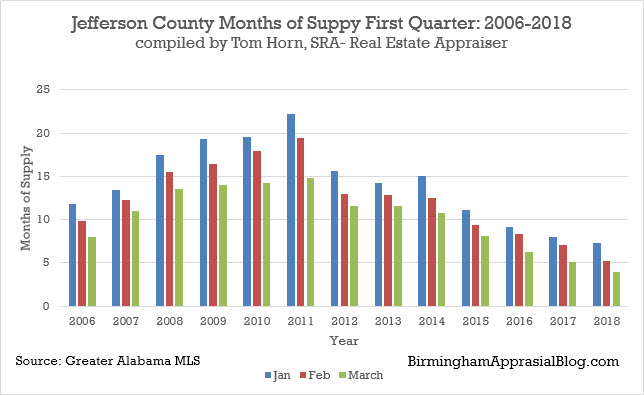
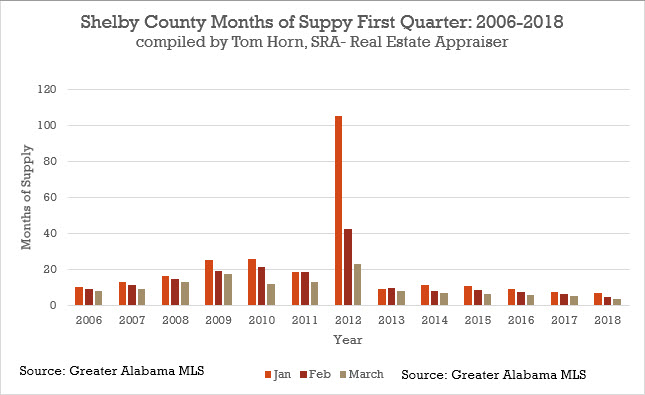
If we do see significant increases in new housing inventory the months of supply will most likely trend upward.
My Thoughts
It’s interesting to note that even though there is a housing shortage the number of houses being sold is steadily increasing. Doesn’t make sense does? I think what may be happening here is that the market is becoming more efficient in pricing and buyers are not hesitating to make an offer on the home they want. It would be interesting to track the withdrawn and expired listings to see what trend they are taking. My guess is that they have steadily declined. I’ll follow up in a later blog post what trend this stat is taking.
Questions?
Do you have any questions about what is occurring in the Birmingham, AL market? Leave a comment below and I’ll do my best to answer it for you.
If you liked this post subscribe by email (or RSS feed). Thanks for visiting.
Very interesting Tom. I love the graphs and the visual story they tell. Some of the images remind me of my market in Sacramento as the number of listings has definitely declined. In my market though sales volume has been steady for a few years despite the number of listings shrinking. This is similar to yours, though we really haven’t seen an increase as you said you’ve had.
Thanks, Ryan. Yes, it is a strange phenomenon. Like I said though, I think of the homes that are listed a larger percentage of them are selling.