A Look At The Birmingham Real Estate Market Through Graphs
We are one month into the new year and most locals are curious about what the Birmingham housing market will look like in 2018. Most people will look at what is happening on a national level and assume that the same will occur locally. My appraisal experience over the past 20 plus years has been that Birmingham real estate trends don’t necessarily follow the rest of the country. Today I’m going to share some charts I put together because, as we all know, a picture is worth a thousand words, right?
Just so you’ll know, the data included in my stats and graphs are from the Greater Alabama MLS. I’m showing the graphs first and then will add my take on the market so scroll down to the bottom.
JEFFERSON COUNTY (single family homes only)
SHELBY COUNTY (single family homes only)
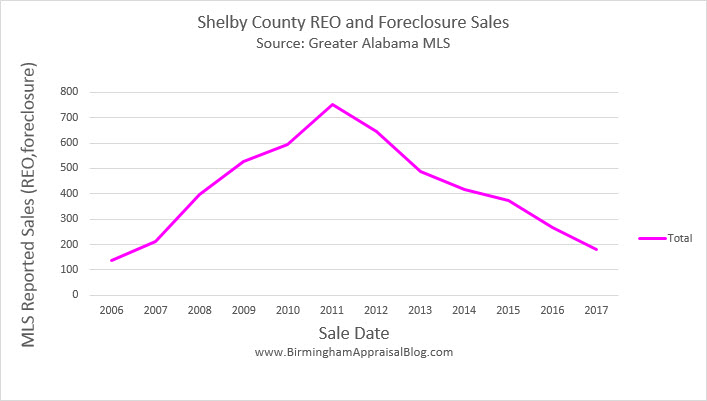
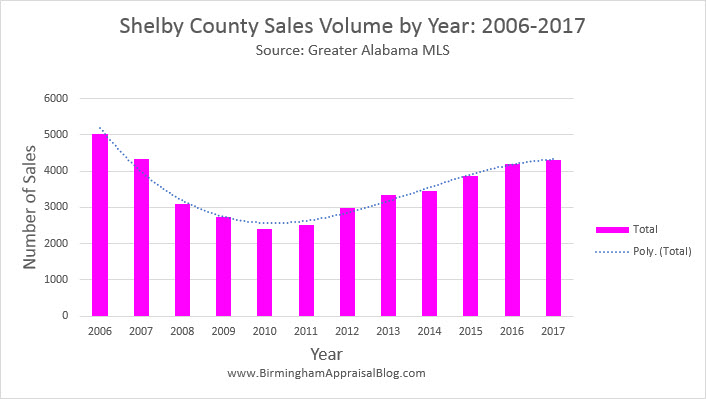
Here are some key takeaways from looking at past sales and current listing activity:
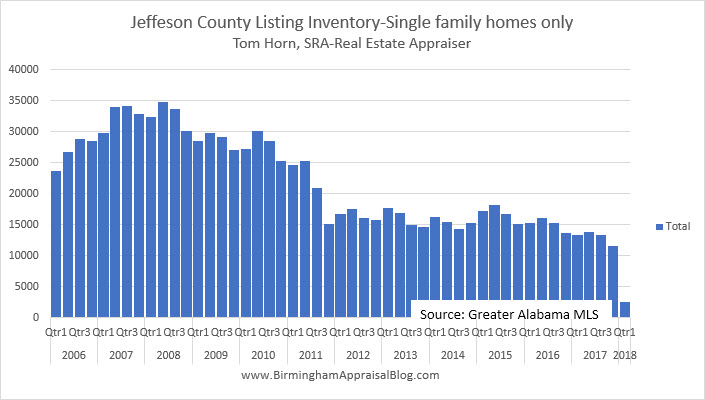
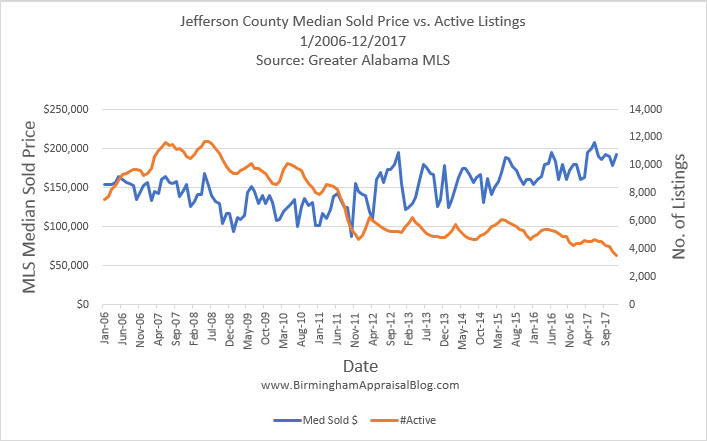
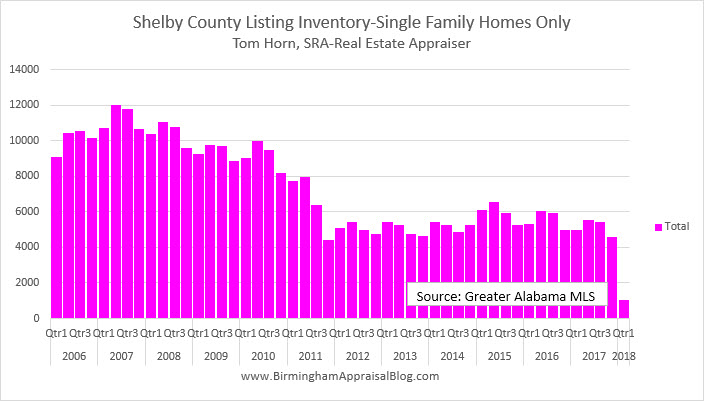
- Overall housing inventory levels in both Jefferson County and Shelby County have decreased steadily since 2007-2008.
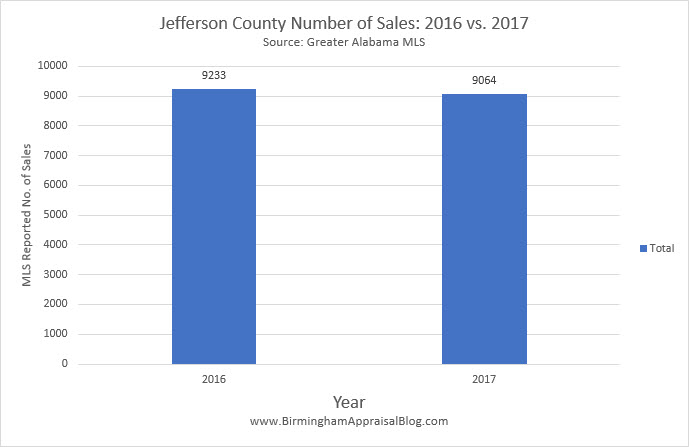
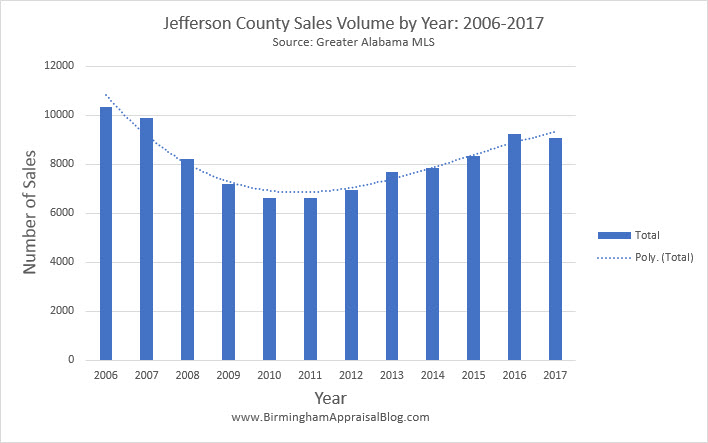
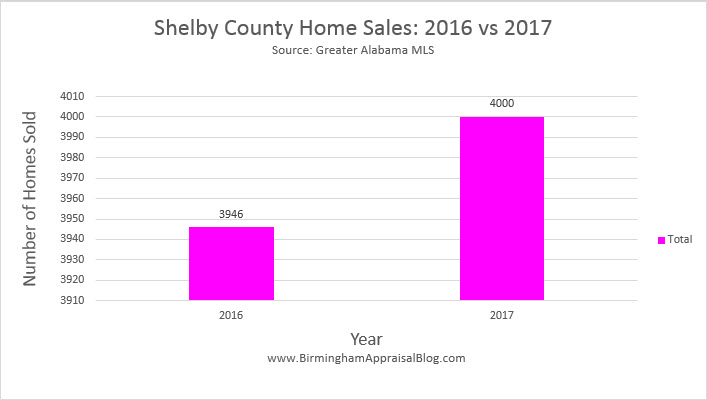
- Limited inventory has resulted in a larger percentage of that inventory selling.
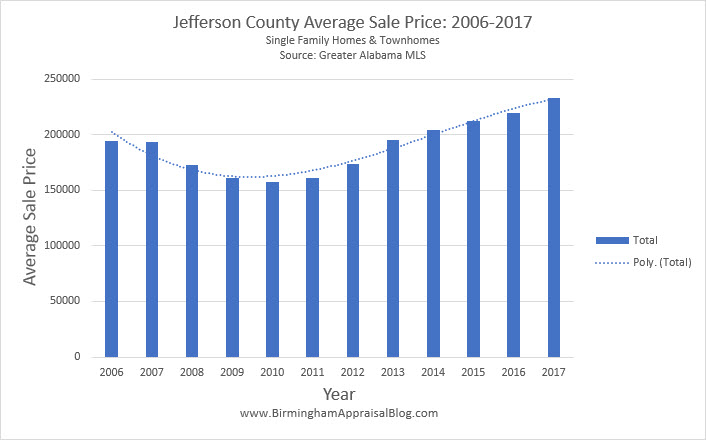
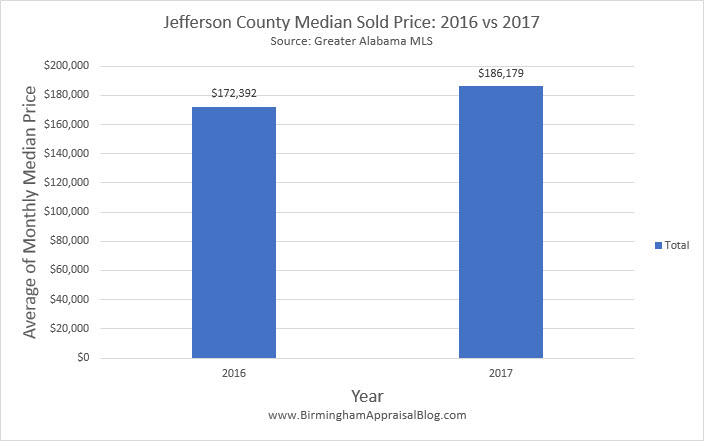
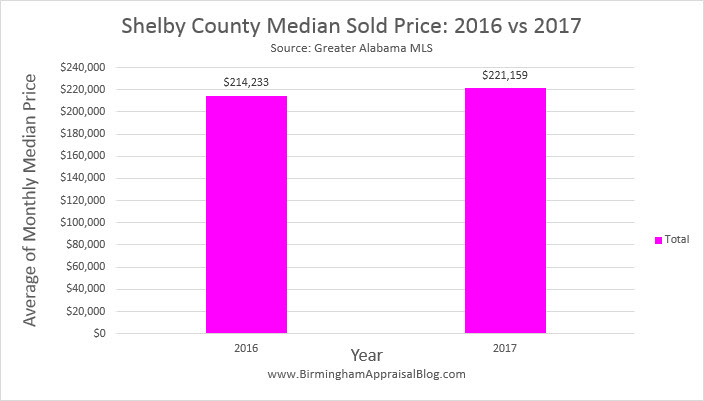
- The median price has gradually increased. This makes sense when you consider the law of supply and demand which states that when supply is limited and demand is good prices will rise. While prices are rising you don’t want to go crazy and overprice your home. Even though prices are on the upswing and overpriced home will not sell.
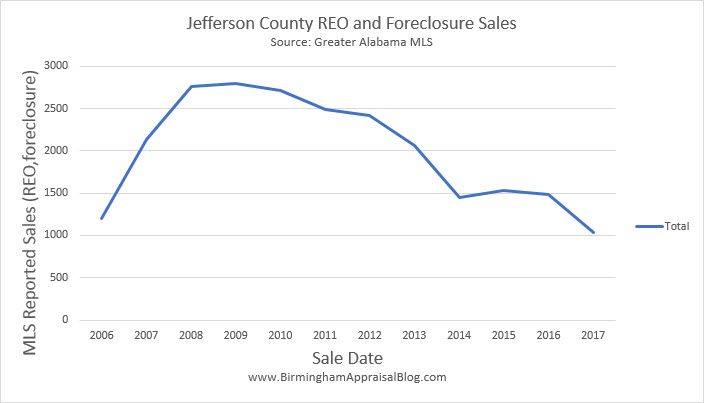
- Another reason that average and median prices are increasing is that there are fewer foreclosure sales on the market to compete with “normal” listings. After the crash, a flood of foreclosures hit the market. These homes were not your typical foreclosure because they were nice homes in good condition. They competed with non-foreclosure homes, so sellers had to decrease their price in order to move it. This resulted in overall prices declining.
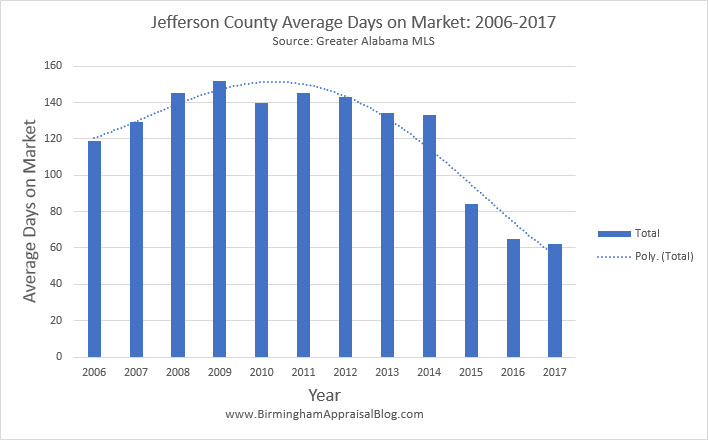
- The days on market, or measure of how long it takes to sell a listing, has steadily decreased. Because inventory is down, the homes that are for sale have been selling quicker.
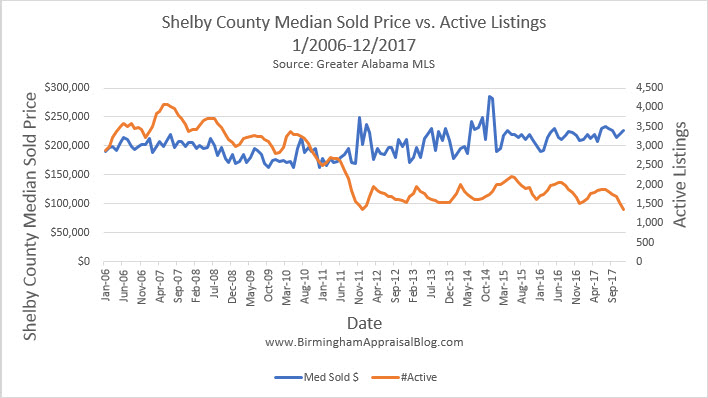
- It’s interesting to note the trend between the median sales price and the number of active listings. We are able to visually see how prices have increased while the inventory dwindles.
So what do these stats mean for buyers and sellers in the Birmingham area? Here are a few thoughts to consider:
- You can be aggressive when pricing your home to sell but make sure you don’t overprice it. Buyers are savvier these days. They do their research about what homes are selling for. Sales data is more readily available online now than it has ever been and buyers are taking advantage of this by knowing what homes are selling for.
- Don’t price your home based on what is happening in other areas but instead find out what the trends are in YOUR neighborhood. Knowing the supply and demand in your neighborhood is crucial.
- Because the days on market has decreased for homes that are competitively priced sellers may want to have a new home or a place lined up to live in because if you price your home right it will sell pretty fast.
If the existing home inventory continues to remain sluggish, new home construction will be critical in order to meet the demand for housing. If you’re looking to purchase a new home you’ll need to check out these subdivisions that had the top sales in 2017:
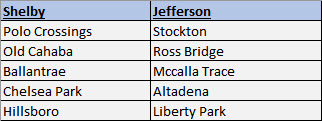
I hope that the housing graphs I have put together can be helpful to you in some way. Real estate values are all about location and each neighborhood is different. If you need to know the value of a specific home an appraisal may be your best bet. If you’d like to order an appraisal or have an appraisal question feel free to contact me.
If you liked this post subscribe by email (or RSS feed). Thanks for visiting.
What a great presentation! The housing graph are really helpful and also the other information that can be of help to buyers.
Thank you.
Nicely presented. Really good comments.
Thanks, Reida. I appreciate the kind words.
Wow Tom, these are awesome graphs. Very well done.
Thanks, Ryan. That means a lot coming from you. 🙂
Terrific Graphs! Great information and analysis for your market!
Thanks, Shannon.
Great information, Tom…especially for my buyers who need time to make a decision when they see something they like. Those days are over. I tell them to come to showings with their pre-approval letter in hand and ready to write a check for earnest money. And for sellers, we’re telling them to get it looking good, price it right, and have a place to go. Crazy market!
Thanks, Mary Jo. I have been hearing the same all the time. With inventory being as low as it is buyers need to make quick decisions or they could lose the home. Thanks for sharing.