Birmingham Home Prices Then and Now
The real estate market is red hot but have you ever considered how much Birmingham home prices have risen since we hit rock bottom after the housing crash back around 2008? Appraiser friend Ryan Lundquist, who runs the Sacramento appraisal blog (I highly recommend you check it out) asked this very question recently so I decided to look at how the Birmingham market is faring.
Some of the numbers may amaze you but let’s consider some context. Comparatively speaking the Birmingham market is relatively stable when compared to other metropolitan areas.
In the past, Birmingham home prices have not seen the extreme highs and lows that other more volatile markets have. While it may seem like we are experiencing this in Birmingham I still believe that we are not as extreme as others.
Of course, the record low-interest rates and shortage of available housing inventory have a lot to do with what we are seeing. Buyers are motivated to purchase a home because they have more buying power to purchase a larger home due to the cheap cost of money.
It’s not only existing owners looking to move up to a larger home but also first-time buyers who see this as an opportunity to participate in the American dream. Many homebuyer’s hopes are being squashed because of the amount of competition there is for a limited supply of homes.
This combination of low-interest rates and limited inventory has resulted in record-high offers, many times over the list price. Today I’m going to take a look at how the prices we are seeing today compare to what they were after the real estate crash I previously mentioned.
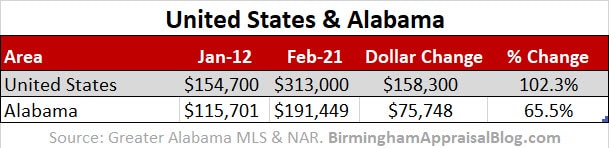
The charts below compare median home prices in January 2012 to February 2021.
The United States & Alabama
Jefferson County & Shelby County

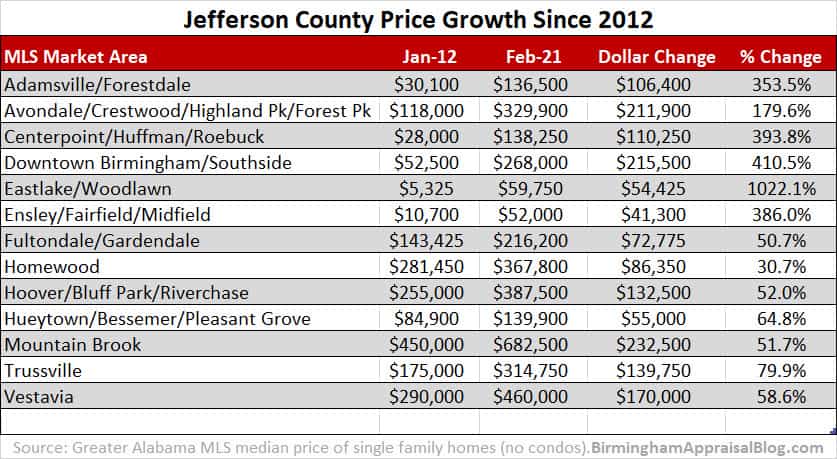
Jefferson County Price Growth
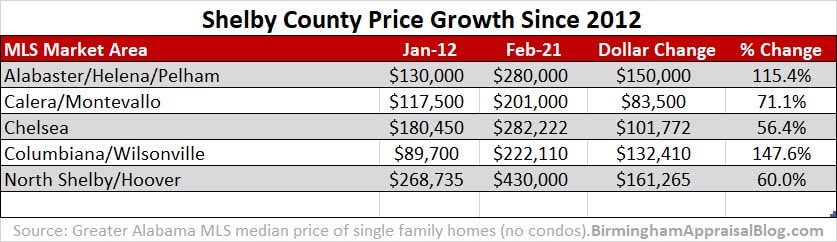
Shelby County Price Growth
Key Takeaways
1) The increase in home prices since 2012 in the state of Alabama trail behind the nation as a whole, however, we still have seen median prices increase by 65%.
2) Within the Birmingham metro area Jefferson County has seen an increase of almost double what Shelby County has. Keep in mind that Jefferson County has more housing inventory than Shelby County does and many areas of Jefferson County have gone through revitalization which has a positive impact on nearby houses. Increased investor activity in some of these areas has also been beneficial as older less expensive homes are purchased, renovated, and flipped for many times more than their previous sale.
3) Some of the areas in Jefferson County have seen huge increases, such as the Eastlake/Woodlawn, Adamsville/Forestdale, Centerpoint/Huffman/Roebuck, Downtown Birmingham/Southside, and Ensley/Fairfield areas. Most of these areas are in the Birmingham urban area and not the various suburbs.
I see two major reasons for this. The first is the presence of older homes that are perfect candidates for purchase and renovation. Investors have identified areas that provide a good return on their investment where they can purchase existing homes that need repair and flip them for a good profit and that are in areas that people want to buy.
The second is the revitalization of the commercial districts in downtown Birmingham such as restaurants and shopping. Many younger purchasers desire to live in an urban environment and Birmingham has a done a good job of bringing in more shopping choices and entertainment districts.
Many of the areas that are experiencing less drastic increases are more stable in nature with less inventory of properties that can be renovated and resold.
4) Shelby County is more similar to those areas in Jefferson county that have been more stable. While prices have increased they are not to the degree that some areas in Jefferson County are.
The Columbiana/Wilsonville area has seen the highest increase in Shelby County. It’s important to keep in mind that this area is more diverse in housing and rural in nature. Homes vary in size and quality and some are on acreage tracts which can boost their price. It could even be a matter of some of these homes with lots of land selling more recently than they did back in 2012.
Conclusion
The Birmingham metro area has seen big increases since 2012 with some locations seeing more than others. Do you have any thoughts?
If you have appraisal questions please leave a comment below or connect with me on social media. As always, thanks for reading.
Hi Tom,
I wonder how far your markets fell from the 2005 peak. This could explain why appreciation is lower than the national average-you had less far to climb to get back to pre-peak levels.
The Birmingham market has always been relatively stable and we did not see many fluctuations in home values post 2005. Of course 2008 was another story.
Is there any reason you did not mention Covid supply and demand and extreme low interest rates for being 2 of the main reasons prices have soared to unrealistic values ? I am confused. You are usually very open and earned my respect many times over, so you owe your loyal follower an explanation.
The low housing supply and interest rates definitely had an impact on property values in 2020 which I have covered in prior blog posts. I’ve never heard it referred to as Covid supply and demand. I think the low supply of homes started long before Covid though. The lowering of interest rates to below 3 percent last year motivated those sitting on the fence to get into action to buy a house and this amplified the problems with low supply because now there were a lot more buyers than before.
Awesome charts Tom. I bet nobody is putting out data like this in your market. Way to go!!
Thanks, Ryan for the challenge of looking at our own area to see how much change there has been and also for the Excel templates! They were a great help.