What are the best stats that describe the Birmingham AL real estate market?
 Almost every time I visit a home to do an appraisal there is one question I get more than any other, and that is “how is the real estate market?”. That’s a question that takes more time than just saying “good” or “average” because there is so much more to the real estate market than a simple one word answer.
In addition to a more thorough answer you have the issue of larger and smaller markets. For example, the Birmingham, Alabama market may be performing in an average way but the smaller Hoover or Vestavia Hills market may be doing better. And to drill deeper you could even say that the Liberty Park subdivision within Vestavia Hills is doing very well.
When discussing real estate I think it is important to be as specific as possible to get the best read on the market. It’s good to know how the overall Birmingham market is doing but it is even better to know how homes are selling within your own neighborhood because that’s what really matters if you want to sell your home or get the highest appraisal possible when borrowing money.
When doing appraisals in various neighborhoods around the Birmingham area I like to share real estate statistics on my blog by writing specific market reports. Because it’s all about context I also like to back up a little and look at a broader picture to see how the overall Birmingham area is performing. Today I’m going to take a look at how the second quarter of 2016 ended up and see how it might compare to the past.
The 5 stats that describe the Birmingham AL real estate market the best include total home sales, median sales price, days on market (DOM), total homes listed for sale (current inventory), and months of housing supply. The figures I have included below are taken from the Greater Alabama MLS and were compiled by the Alabama Center for Real Estate.
Total Home Sales
The number of homes sold can provide a good indication of the health of the housing market especially when you compare current numbers to past years. Of course an increase over past years obviously shows an increase in demand which indicates a higher confidence level in economic conditions such as job stability and credit availability.
The total home sales for the second quarter of 2016 was at 4,345, which is 398 more than the second quarter in 2015. Home sales volume is at its highest since 2011, however it is still below the peak we saw in 2007 when sales were at 5,346 homes.
Median Sales Price
You can look at both average sales price and median sales price when discussing pricing trends but I prefer median
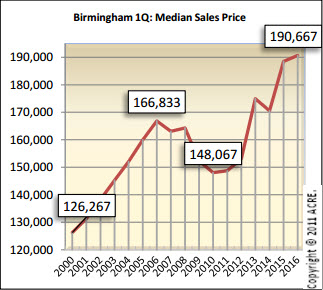
courtesy Alabama Center for Real Estate
sales price. It provides a more reliable number because it is not influenced by outlier sales that can sell for unusually high or low prices. As with any other stat it’s not good to just look at one metric.
An increase in median sale price can give us an indication that prices are rising due to appreciation or it may also just mean that there were more upper priced homes selling during this time period and less lower priced homes. This is where studying the smaller sub market is good because it will isolate the sales to a certain location which can give us a better feel for the market.
The median sales price of homes in the Birmingham AL market for the second quarter of 2016 was $190,667. This is an increase over the second quarter of 2015 which was at $188,500. According to data compiled by the Alabama Center for Real Estate this is also the highest amount recorded for the second quarter going back to the year 2000.
Days on market (DOM)
The number of days it takes to sell a home provides valuable information because it can give an indication to what type of market we have. A longer than normal time on the market most likely indicates higher inventory levels and/or a decrease in demand, which could provide valuable data to sellers. This may help them make a decision on how aggressively they want to price their home.
The average number of days it took to sell a home during the second quarter of 2016 was at 69, down 5 days from the same time last year. This makes sense considering the reduced inventory levels we have been hearing about.
From a buyer’s perspective this should tell them that if they are interested in purchasing a home they need to put in an aggressive offer and don’t lowball the seller because the seller can probably move on to the next buyer and get their asking price.
Total homes listed for sale
The total homes listed for sale is just another way of describing current inventory. As I noted above, the word around town is that inventory levels are low, however compared to last year this is not true for the Birmingham area as a whole. Total homes listed for sale, according to the Greater Birmingham MLS, was at 7,373 compared to 7,005 last year at the same time. As you know, real estate is location specific and certain areas may have more or less inventory that they did last year.
Because real estate is location specific I hate to look at the larger market without also looking at a specific neighborhood or subdivision because the numbers can be totally different. One submarket may be booming while the larger metropolitan area could be performing to a lesser degree.
Month of housing supply
Tied directly to the total homes listed for sale is the months of housing supply statistic. This is a measure of how long it would take to sell out the current inventory of homes given the current rate of sales over recent months without any more homes being added.
During the second quarter of 2016 the average months of housing supply was at 5.1, meaning it would take 5.1 months to sell all of the homes listed if no other were added to the inventory. At 5.1 months the market is considered to be in balance and it is slightly less than the same time last year when it was at 5.3 months. Historically speaking it is down from the 5 year average of 7.5 months and also lower than its peak of 11.3 months in 2012.
Question
Do you have any questions about these stats that describe the Birmingham AL real estate market? As I stated previously knowing how your specific neighborhood is doing can help you make better informed decisions when selling your home.
I can provide appraisal services to give you more insight into what to list your home at and also what stategy you should use by looking at current housing inventory levels. If you have a question or comment please leave a message below and we’ll keep the conversation going. Thanks for reading.
If you liked this post subscribe by email (or RSS feed). Thanks for visiting.
What areas around Birmingham (particularly within Shelby County) tend to have shortest time on the market before selling, do you suppose? Any advice on where to access the most accurate and current statistics on local real estate?
That is a difficult question. Each area has its own share of popular neighborhoods where homes sell quickly. A good website to see a good macro picture of various markets is the one the Alabama Center For Real Estate has. This is the website: http://acre.cba.ua.edu/
Great statistics on the Birmingham market. I’m guessing one stat the describes it right now is rain. However, I too found it interesting that you’re so far above the peak in 2006. In my market, we are above 2006, but not by that much.
Thanks Gary.
Very interesting to see the median price way above the previous peak about 10 years ago (if I’m reading that graph correctly). My market in Sacramento is still a good 15% or so below that. It seems your market did not utterly tank like it did in California. 🙂
You’re right Ryan. The Birmingham, AL real estate market did not reach the highs that other market did and it has been relatively stable. We did have areas that bottomed out but not to the degree that you may have seen.